
5 Pi Network Chart Patterns that Recur Throughout 2025
Jakarta, Pintu News – Despite PI’s status as a token with limited liquidity and adoption, Pi Network’s price chart throughout 2025 shows some recurring technical patterns.
These patterns often appear during periods of rebound or correction – and can be useful for market participants who monitor movements on a short- or medium-term basis. This article summarizes five of the most striking chart patterns and the events that accompany them.
1. Tight Consolidation Before Price Spikes
During some periods of 2025, especially before major price spikes, PI exhibits a relatively flat consolidation phase – prices move in narrow ranges for several days. For example, historical data shows that in October 2025, PI prices moved heavily in a narrow range before then rising to the US$0.25-0.26 range.
This consolidation pattern is often accompanied by low or steady trading volumes, indicating that the market is waiting for a major catalyst. When a catalyst appears – such as positive sentiment, an exchange listing, or a community announcement – prices often surge out of the consolidation range, triggering a quick reaction from market participants.
2. Rebound from Key Support Point
Throughout 2025, PI showed a repeated rebound pattern every time it touched a critical support area. According to historical data, the price touched a low of around US$0.226-0.228 before reversing upwards several times.
Any rebound like this is often followed by a surge in volume, signaling an influx of buyers in the belief that support has been tested. This pattern shows that despite high volatility, there is a guard zone (support) that many traders consider psychologically safe.
Also read: BTC Price Prediction at the End of 2025: Market Optimism Reaches $100,000!
3. Breakout After Triangle/Pennant Formation
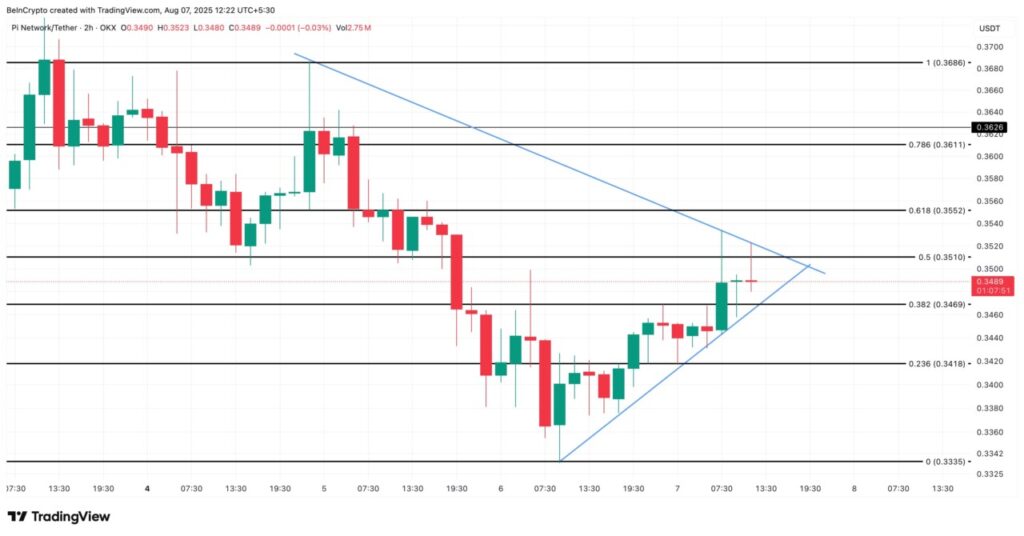
In mid-2025, there were periods where PI formed a consolidation pennant or triangle pattern in the medium timeframe, followed by a strong breakout. Technical analysis of one of these periods noted that the breakout triggered a price spike to a range above US$0.35, although it did not last long.
Each breakout like this attracts the interest of short-term speculators, often triggering high volumes and fast price movements. However, they are sensitive to liquidity – if there isn’t large volume, the breakout can fail and prices correct again.
4. High Volatility and Extreme Candles
Due to its relatively small liquidity, PI often experiences extreme price movements in a short period of time – with long candles on the chart. For example, historical data shows PI reaching significant daily highs and then correcting within hours.
This reflects the characteristics of a token with a wide supply distribution and a sentiment-sensitive market. This high volatility can have a big impact – both as an opportunity, and a big risk for traders who don’t take liquidity into account.
Also read: Is XRP price ready to soar? Here are the contributing factors!
5. Short Rally on Positive Community Sentiment
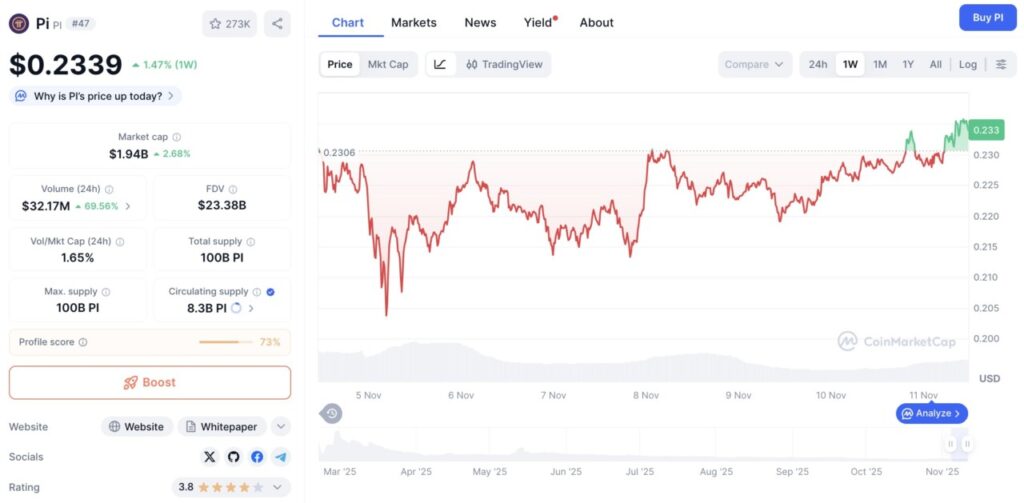
Several times throughout 2025, when there was positive news regarding roadmaps, exchange listings, or community announcements, PI recorded short rallies up 5-10% within 24-48 hours. For example, on November 11, 2025, PI rose about 2.96% in a day, outperforming the crypto market in general.
Such rallies often serve as short-term price “hardeners” – especially for investors who believe in the utility or long-term potential of the project. But such rallies are sometimes not followed by strong fundamentals, so they risk a quick correction if sentiment dissipates.
Conclusion
Although Pi Network still faces uncertainties regarding adoption and liquidity, the chart patterns that emerged throughout 2025-such as consolidation before a surge, rebound from support, breakout from a pennant, high volatility, and rally when sentiment is positive-suggest that this token has the typical trading characteristics of a small crypto. Understanding these patterns can help traders and investors recognize momentum-although risks remain high.
FAQ
What do “support” and “resistance” mean in the context of Pi Network pricing?
Support is the price level at which demand is considered strong enough to withstand further decline; resistance is the level at which selling pressure is likely to emerge and hold back further price increases.
Why does Pi Network often show high volatility compared to major cryptos?
Due to the relatively small liquidity and volume of the market, a slight movement of large buy or sell orders can trigger drastic price changes.
Does a pattern like a pennant breakout guarantee that the price will continue to rise?
Not always – breakouts need to be supported by large trading volumes for validation; without volume, prices can correct back.
How can investors effectively monitor Pi chart patterns?
Use daily or 4-hour charts, look at trading volume, support/resistance lines, and confirmation from technical indicators before assessing the breakout.
Are these chart patterns useful for long-term prediction of Pi prices?
Chart patterns are more relevant for short-medium term signals; long-term predictions remain dependent on utility, project adoption, and fundamental developments.
That’s the latest information about crypto. Follow us on Google News to get the latest crypto news about crypto projects and blockchain technology. Also, learn crypto from scratch with complete discussion through Pintu Academy and stay up-to-date with the latest crypto market such as bitcoin price today, xrp coin price today, dogecoin and other crypto asset prices through Pintu Market.
Enjoy an easy and secure crypto trading experience by downloading Pintu crypto app via Google Play Store or App Store now. Also, get a web trading experience with various advanced trading tools such as pro charting, various types of order types, and portfolio tracker only at Pintu Pro.
*Disclaimer
This content aims to enrich readers’ information. Pintu collects this information from various relevant sources and is not influenced by outside parties. Note that an asset’s past performance does not determine its projected future performance. Crypto trading activities have high risk and volatility, always do your own research and use cold cash before investing. All activities of buying and selling bitcoin and other crypto asset investments are the responsibility of the reader.
Reference
- CoinMarketCap
- CoinGecko
- BeinCrypto / Indodax. Pi Coin Price Bullish Shift August 2025. Accessed on November 29, 2025
- Featured Image: Coingape