Bitcoin Falls to $66,000 as BTC Remains Capped Below Key Resistance
Jakarta, Pintu News – Bitcoin (BTC) price is still moving in a narrow range around $66,100. Amidst the generally flat movement of the crypto market, BTC is still holding at an important support area, indicating that there is still demand at that level.
However, behind this seemingly calm price movement, a high-stakes market situation is slowly forming. The latest liquidation data shows that there is considerable imbalance in the market, so the next move is likely to be influenced more by liquidity positioning than market sentiment.
Under these conditions, the direction of Bitcoin’s next move is likely to be determined by the location of the largest concentration of leveraged positions in the market. This makes the current situation more of a liquidity-driven scenario, rather than a momentum-driven breakout.
Bitcoin Price Drops 0.14% in 24 Hours
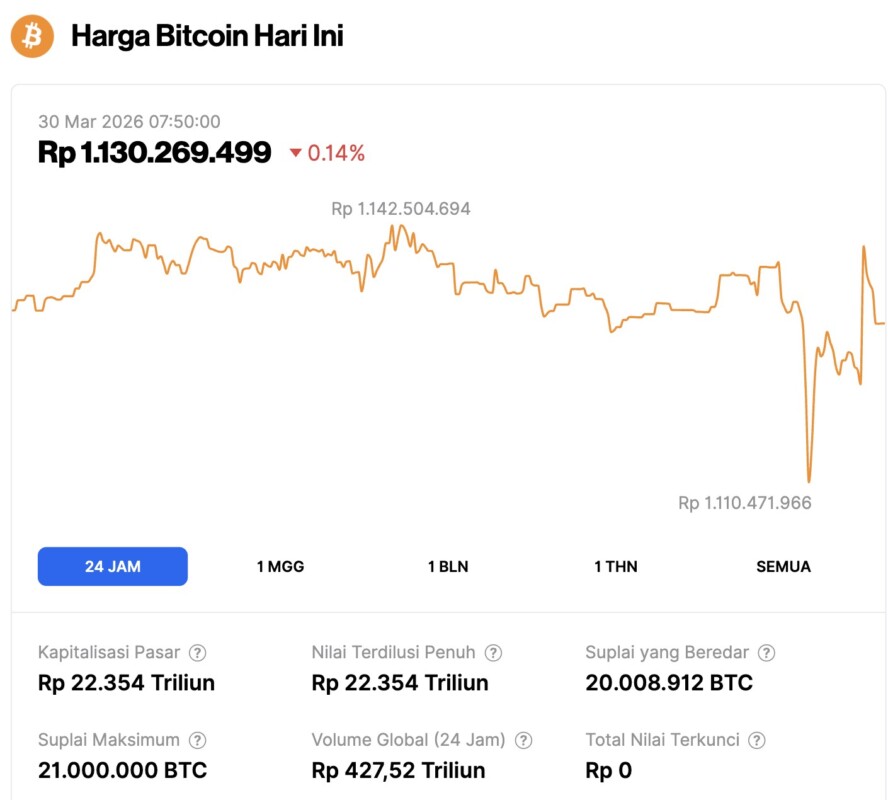
As of March 30, 2026, Bitcoin was trading at $66,177, or approximately IDR 1,130,269,499, after posting a slight 0.14% decline over the past 24 hours. During that period, BTC fell to a low of IDR 1,110,471,966 and climbed to a high of IDR 1,142,504,694.
At the time of writing, Bitcoin’s market capitalization stood at roughly IDR 22,354 trillion, while its 24-hour trading volume rose 10% to IDR 427.52 trillion.
Read also: 2 Altcoins Targeted by Institutional Investors Ahead of CLARITY Act, Potential to Explode?
Bitcoin Liquidation Map: Where the Biggest Pressure Is
The latest liquidation data shows a huge imbalance in the derivatives market. Currently, there is an accumulation of over $12 billion worth of short positions above the current Bitcoin price, while the potential liquidation of longs below the price is only in the range of $3 billion.
This unequal distribution confirms one important point: liquidity is much more concentrated on the upside, so the current market pressure is more formed above the current price range.
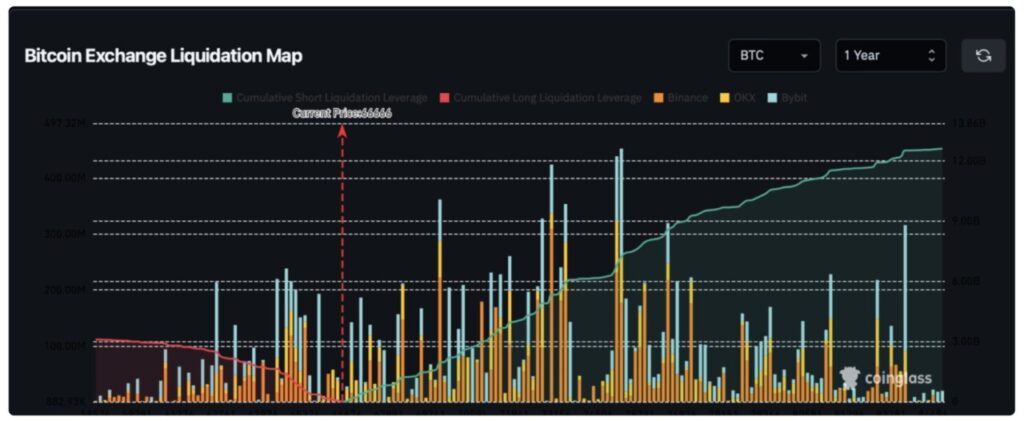
In the short term, BTC prices are considered more likely to move up to hunt down the pool of short positions, which could potentially trigger a short squeeze. Even so, this condition does not necessarily signal the beginning of a sustainable bullish trend. Liquidity-driven movements are generally temporary and are often followed by a sharp correction after these positions are swept away.
This means that while prices have the potential to rally in the near term, traders still need to be wary of a possible pullback once liquidity is absorbed.
Bitcoin Price Analysis: BTC Still Held Below Key Resistance
As of March 29, Bitcoin was trading around the $66,600 level and is still moving in a narrow range after failing several times to break the $70,000-$72,000 area. The 4-hour chart shows no strong directional momentum yet, with a slightly bearish short-term trend.
A closer look at the Bollinger Bands shows that BTC is still moving below the center line, indicating that buyers are still struggling to take back control of the market.
Read also: 3 Altcoins that could potentially trigger a big liquidation wave this week
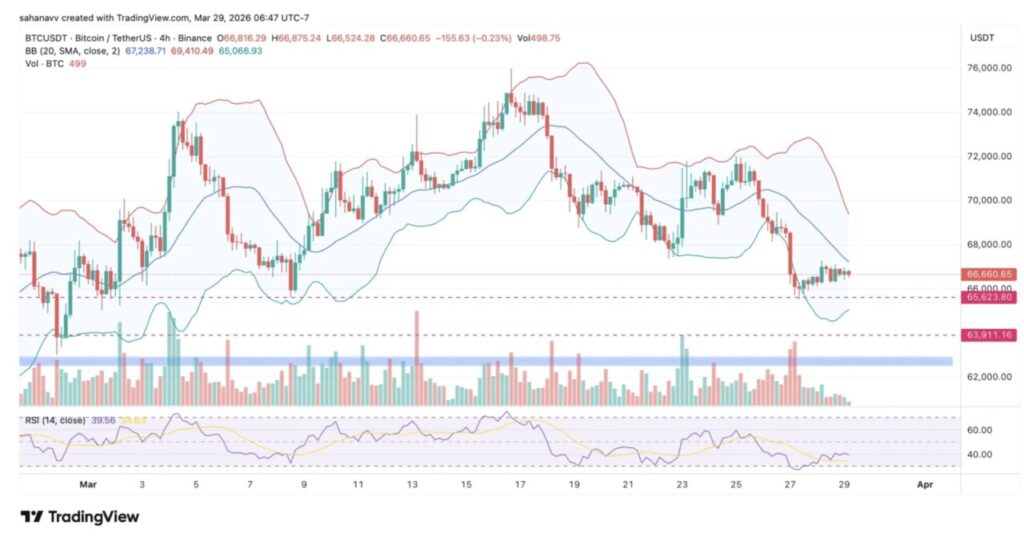
Although the price bounced off the lower Bollinger Band around $65,000, the recovery still looks weak. This indicates that the upswing is likely to be temporary, rather than a confirmed reversal.
Meanwhile, the Relative Strength Index (RSI) hovers around the 40 level, reflecting neutral to bearish momentum. This suggests that the market is not yet in an oversold area, but also doesn’t have enough strength to sustain a sustained rise.
An important level to note:
- Nearby Resistance: $68.000
- Main Resistance: $70.000-$72.000
- Nearby Support: $65.600
- Strong support: $63.900
Conclusion: Liquidity Signals Show Strength, but Bitcoin Price Still Needs Confirmation
Currently, Bitcoin is caught between bullish liquidity signals and a weak price structure, creating market conditions with both high risk and great opportunity.
In the short term, Bitcoin could potentially experience a short squeeze towards the $68,000-$70,000 range driven by liquidity movements. However, if BTC fails to hold above that area, the rise could turn into a bull trap and be followed by downward pressure again.
On the contrary, if the price breaks below the $65,600 level, then the next important support area is around $63,900, which is expected to be the entry zone for the buyers.
Follow us on Google News to stay up to date with the latest in crypto and blockchain technology. Check Bitcoin price, usdt to idr and tokenized nvidia stock price through Pintu Market.
As a safe crypto app, Pintu provides a crypto trading experience to access crypto gold investment easily and conveniently. You can also see today’ s gold jewelry price and today’s gold bullion price to support your investment activities and portfolio diversification as well as learn crypto through Pintu Academy.
Download the Pintu crypto app via Play Store or App Store now. Enjoy web trading experience with advanced trading tools such as pro charting, various types of order types, and portfolio tracker only at Pintu Pro.
*Disclaimer
This content aims to enrich readers’ information. Pintu collects this information from various relevant sources and is not influenced by outside parties. Note that an asset’s past performance does not determine its projected future performance. Crypto trading activities are subject to high risk and volatility, always do your own research and use cold hard cash before investing. All activities of buying and selling Bitcoin and other crypto asset investments are the responsibility of the reader.
Reference:
- Coinpedia. $12B Shorts vs $3B Longs-Is Bitcoin Price Set for a Short Squeeze Rally? Accessed on March 30, 2026