3 Strong Signals Ethereum (ETH) is Ready to Break $2,800
Jakarta, Pintu News – Ethereum (ETH) is back in the spotlight after showing a significant price spike in recent days. Market participants are now increasingly convinced that the price of Ethereum (ETH) has the potential to break the $2,800 level in March.
This optimism is supported by three technical and on-chain indicators that strengthen the chances of price increases. With the momentum continuing to strengthen, Ethereum (ETH) has the potential to be the belle of the ball amidst crypto market volatility.
Technical Indicators: Symmetrical Triangle Breakout and Bullish Signal
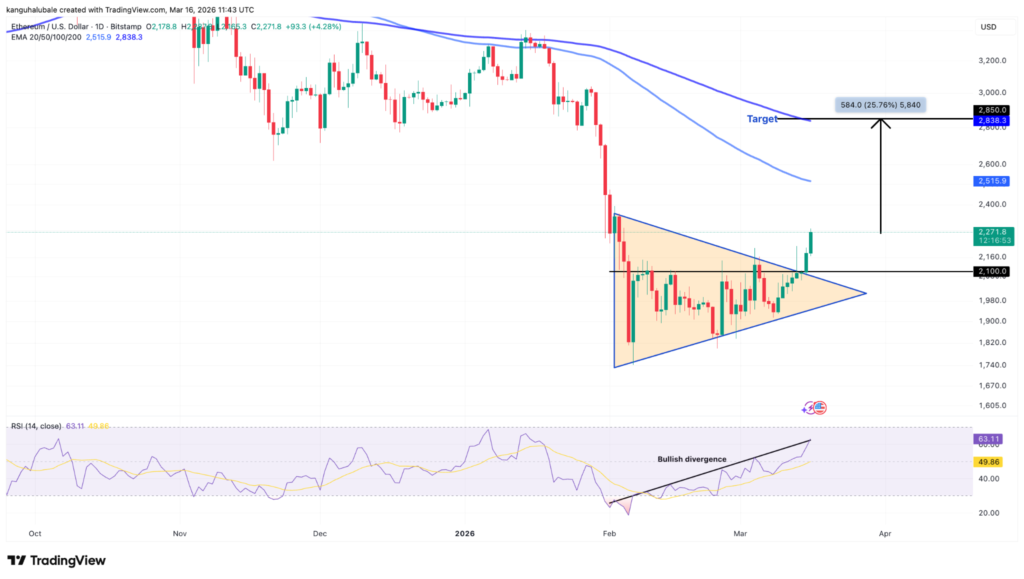
Ethereum (ETH) price movement recently broke out of the symmetrical triangle pattern formed on the daily chart. This breakout occurred after the price of Ethereum (ETH) broke the upper trend line at the $2,100 level, accompanied by a surge in trading volume signaling strong conviction from buyers.
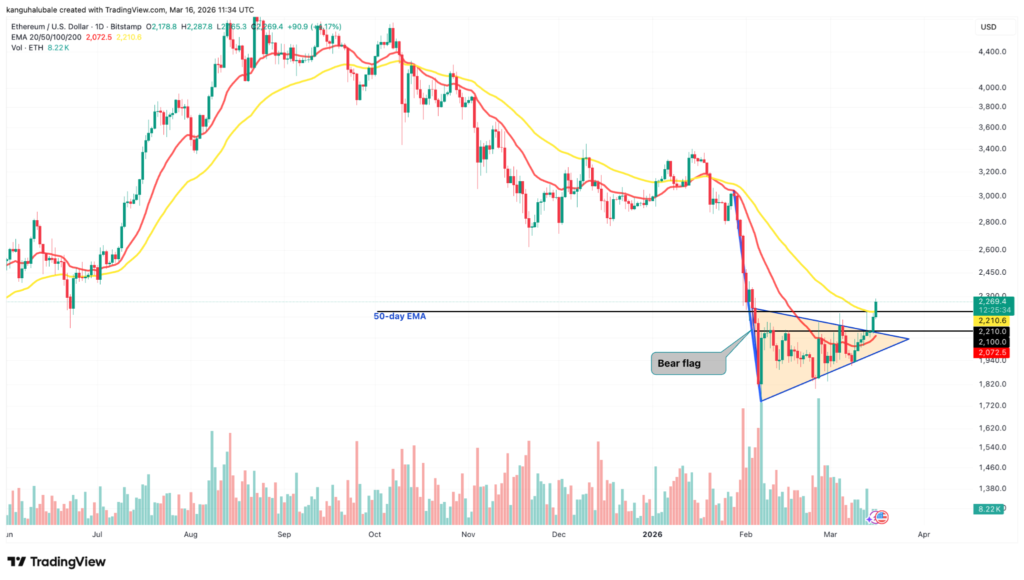
In addition, the price also managed to reclaim two important support lines, namely the 20-day exponential moving average (EMA) at $2,072 and the 50-day EMA at $2,210. This increases the chances of a bullish reversal that could push the price towards $2,850, in line with the symmetrical triangle pattern projection.
However, the journey to $2,800 will not be so smooth. Ethereum (ETH) still has to face strong resistance at the 100-day EMA which is around $2,500. In case of rejection in this area, a potential price correction could occur and weaken the bullish momentum. Therefore, analysts highlight the importance of a breakout above $2,500 as further confirmation towards the $2,800 target.
Read also: 1 Pi Network (PI) Price in Indonesia Today (3/17/26)
On-Chain Data: Supply Overhang and Accumulation Zone at $2,800
Analysis of on-chain data shows that Ethereum (ETH) is currently moving in a fairly wide price range, with an upper bound at the realized price of $2,350 and a lower bound at the lowest MVRV band of $1,650. This rebound pattern from the lowest MVRV band is similar to the market structure in the second quarter of 2022, where the price briefly broke through the realized price before being held at the first MVRV band above it.
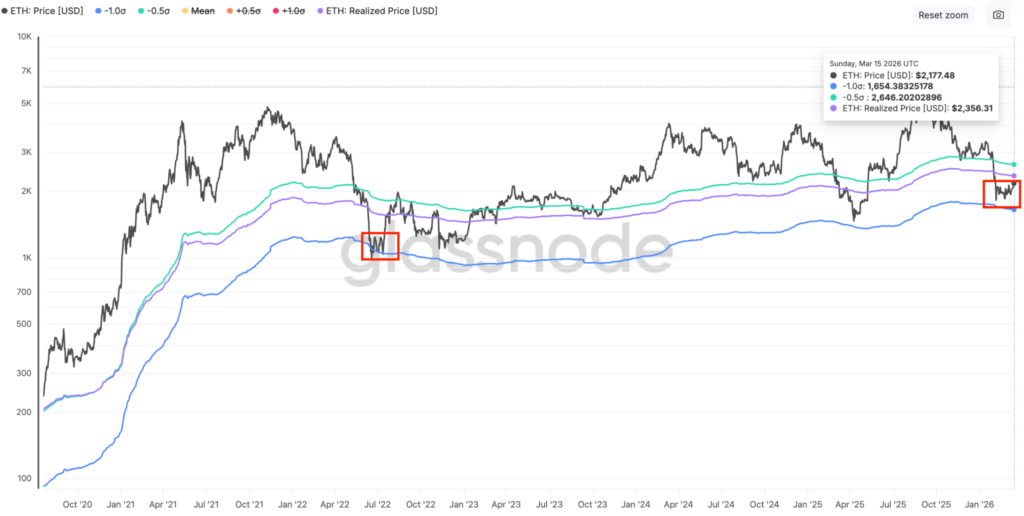
This reinforces the notion that the current price recovery may stall around $2,650, where there is resistance from the first MVRV band. In addition, data from Glassnode shows a dense supply zone in the range of $2,770-$2,880, where more than 7.9 million Ethereum (ETH) has been bought by long-term investors.
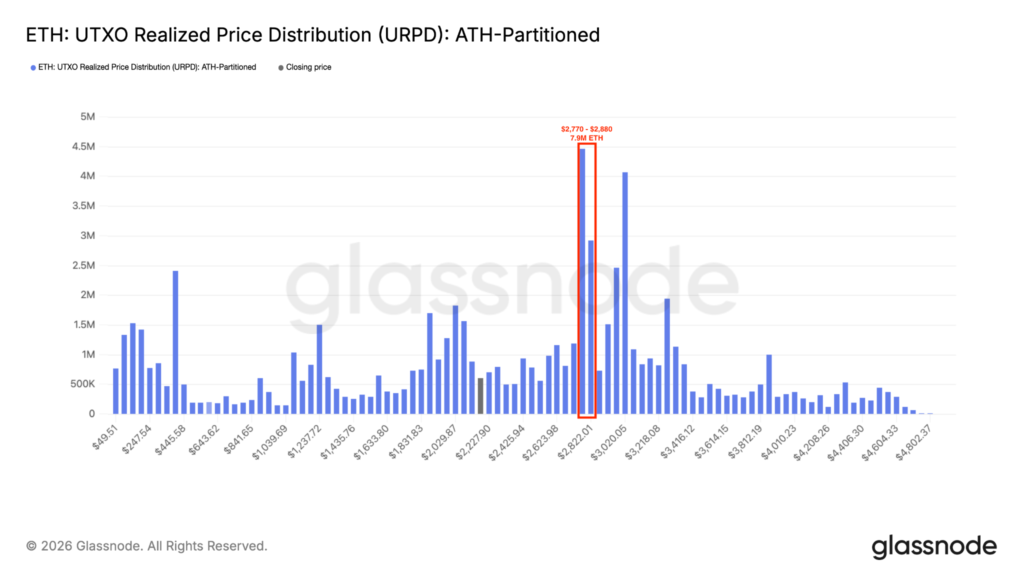
This zone is a source of unresolved selling pressure and could potentially limit price gains around $2,800. However, the cost-basis distribution heatmap also indicates massive accumulation at the $2,800 level, with over 3 million Ethereum (ETH) having been bought in the area. This opens up the opportunity for the price to test that level in the near future.
Read also: World Oil Price per Barrel Today, Tuesday, March 17, 2026
Market Predictions: Polymarket Optimistic $2,800 Target Achieved
Polymarket, a crypto-based prediction platform, is showing increased optimism towards the potential price rise of Ethereum (ETH) in March. Based on the latest data, the chances of Ethereum (ETH) reaching $2,800 in March rose to 13%, an increase of 10% in just the last 24 hours. Meanwhile, price targets of $2,600 and $2,400 have a higher probability of 32% and 69% respectively.
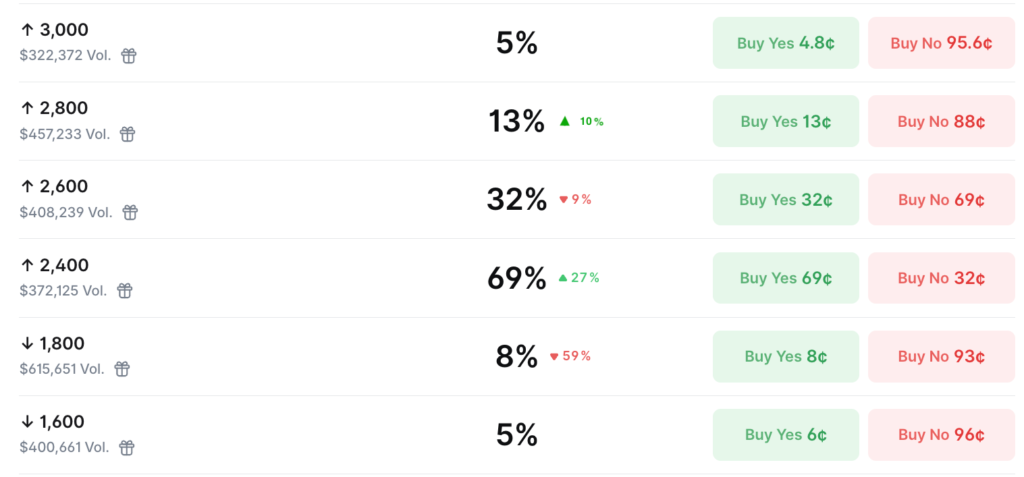
This indicates that the market sentiment is increasingly leaning in a bullish direction, with expectations of a price drop getting smaller. On the other hand, the chances of Ethereum (ETH) price dropping to $1,800 or even $1,600 in March are diminishing. Market participants seem to be reducing expectations of price drops as the bullish momentum strengthens.
With a combination of technical analysis, on-chain data, and positive market sentiment, Ethereum (ETH) has the potential to continue its rally towards the $2,800 psychological level. However, investors still need to be wary of a potential correction amid high crypto market volatility.
Follow us on Google News to stay up to date with the latest in crypto and blockchain technology. Check Bitcoin price, usdt to idr and tokenized nvidia stock price through Pintu Market.
As a safe crypto app, Pintu provides a crypto trading experience to access crypto gold investment easily and conveniently. You can also see today ‘ s gold jewelry price and today ‘ s gold bullion price to support your investment activities and portfolio diversification as well as learn crypto through Pintu Academy.
Download the Pintu crypto app via Play Store or App Store now. Enjoy web trading experience with advanced trading tools such as pro charting, various types of order types, and portfolio tracker only at Pintu Pro.
*Disclaimer
This content aims to enrich readers’ information. Pintu collects this information from various relevant sources and is not influenced by outside parties. Note that an asset’s past performance does not determine its projected future performance. Crypto trading activities are subject to high risk and volatility, always do your own research and use cold hard cash before investing. All activities of buying and selling Bitcoin and other crypto asset investments are the responsibility of the reader.
Reference
- Cointelegraph. Three Ethereum indicators hint at $2.8K as the next ETH price target. Accessed on March 17, 2026
- Featured Image: Generated by AI