5 Months in the Red! XRP in danger of falling to IDR8,379 or rising 40%?
Jakarta, Pintu News – The movement of Ripple (XRP) is back in the spotlight of crypto and cryptocurrency players after recording five consecutive red candles on the monthly chart. This pattern has sparked concerns as well as speculation about the potential for further declines and reversal opportunities. Novice investors to experienced traders are now looking closely at whether XRP will continue its downtrend or prepare for a significant rebound momentum.
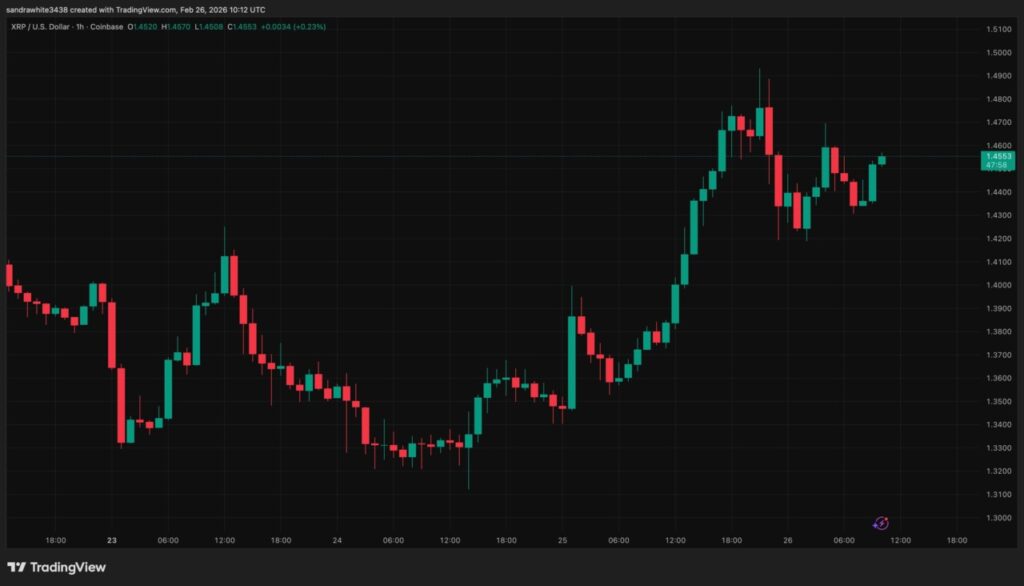
1. 5 Monthly Red Candles: Signal of Strong Selling Pressure
In technical analysis, five consecutive monthly red candles indicate consistent selling pressure in the medium term. This pattern is relatively rare for large cryptocurrencies and often reflects a cautious market sentiment. For those of you who are new to the cryptocurrency world, a red candle means that the closing price is lower than the opening price in that period.
This indicates that for the past five months, sellers have dominated the XRP market. Historically, consecutive selling pressure can trigger a capitulation phase before prices find a new equilibrium point. However, not all downtrends end in extreme declines as fundamental factors and macro sentiment also play an important role.
Also Read: 5 Easy Steps to Buy Gold at a Gold Boutique, a Safe Investment Other than Crypto!
2. Worst-Case Scenario: XRP Could Drop to IDR8,379
Some analysts predict that if the selling pressure continues, XRP could potentially drop towards the next support area around $0.50. Assuming an exchange rate of 1 USD = IDR16,759, this level is equivalent to around IDR8,379. Support levels are price areas that have historically tended to resist declines as buying interest increases.
If that support fails to hold, the potential correction could deepen. However, in the crypto cycle, sharp downward phases are often followed by consolidation before a new direction is established. Therefore, it is important for you to understand that volatility is a key characteristic of the cryptocurrency market.
3. Rebound Opportunity: Up to 40% Upside Potential
On the other hand, a long downward pattern can also open up opportunities for technical rebounds. If XRP is able to maintain a strong support area and there is an increase in buying volume, the price has the potential to rise back up to 40% from the lowest level. This kind of increase often occurs when the market considers an asset to be oversold or too cheap.
A 40% rebound in the crypto context is not unusual, especially when global sentiment improves. Price movements can be triggered by catalysts such as regulatory developments, institutional adoption, or related blockchain ecosystem updates. However, this scenario remains subject to technical confirmation and broader market sentiment.
4. Crypto Market Fundamental and Sentiment Factors
In addition to chart analysis, fundamental factors also affect the price of Ripple (XRP). Legal case developments, partnership expansions, as well as the dynamics of the global cryptocurrency industry can either strengthen or weaken investor sentiment. Therefore, price movements are not only determined by candle patterns alone.
The crypto market is also highly sensitive to macroeconomic conditions such as interest rate policy and global liquidity. When risk assets come under pressure, altcoins like XRP are often affected more than Bitcoin (BTC). Therefore, it’s important to look at the whole market picture before making any decisions.
5. Investor Strategy: Between Risk and Capital Management
In volatile situations like this, risk management is key. You need to determine your loss limit, profit target and investment horizon before entering the market. This approach helps reduce impulsive decisions that often occur when prices move sharply.
For long-term investors, a price correction may be viewed as an accumulation phase if the fundamentals remain solid. Meanwhile, short-term traders usually wait for confirmation of a reversal pattern before opening a position. Understanding your personal risk profile will help you navigate the dynamics of cryptocurrency more rationally.
Follow us on Google News to stay up to date with the latest in crypto and blockchain technology. Check Bitcoin price, usdt to idr and tokenized nvidia stock price through Pintu Market.
Enjoy an easy and secure crypto trading and crypto gold investment experience by downloading the Pintu crypto app via Play Store or App Store now. Also, experience web trading with advanced trading tools such as pro charting, various order types, and portfolio tracker only at Pintu Pro.
Also Read: 5 Secrets of Today’s World Gold Price in the Forex Market, Crypto Investors Must Read!
*Disclaimer
This content aims to enrich readers’ information. Pintu collects this information from various relevant sources and is not influenced by outside parties. Note that an asset’s past performance does not determine its projected future performance. Trading crypto carries high risk and volatility, always do your own research and use cold hard cash before investing. All activities of buying and selling Bitcoin (BTC) and other crypto asset investments are the responsibility of the reader.
Reference
- NewsBTC. XRP Prints 5 Monthly Red Candles in a Row. Accessed February 27, 2026.